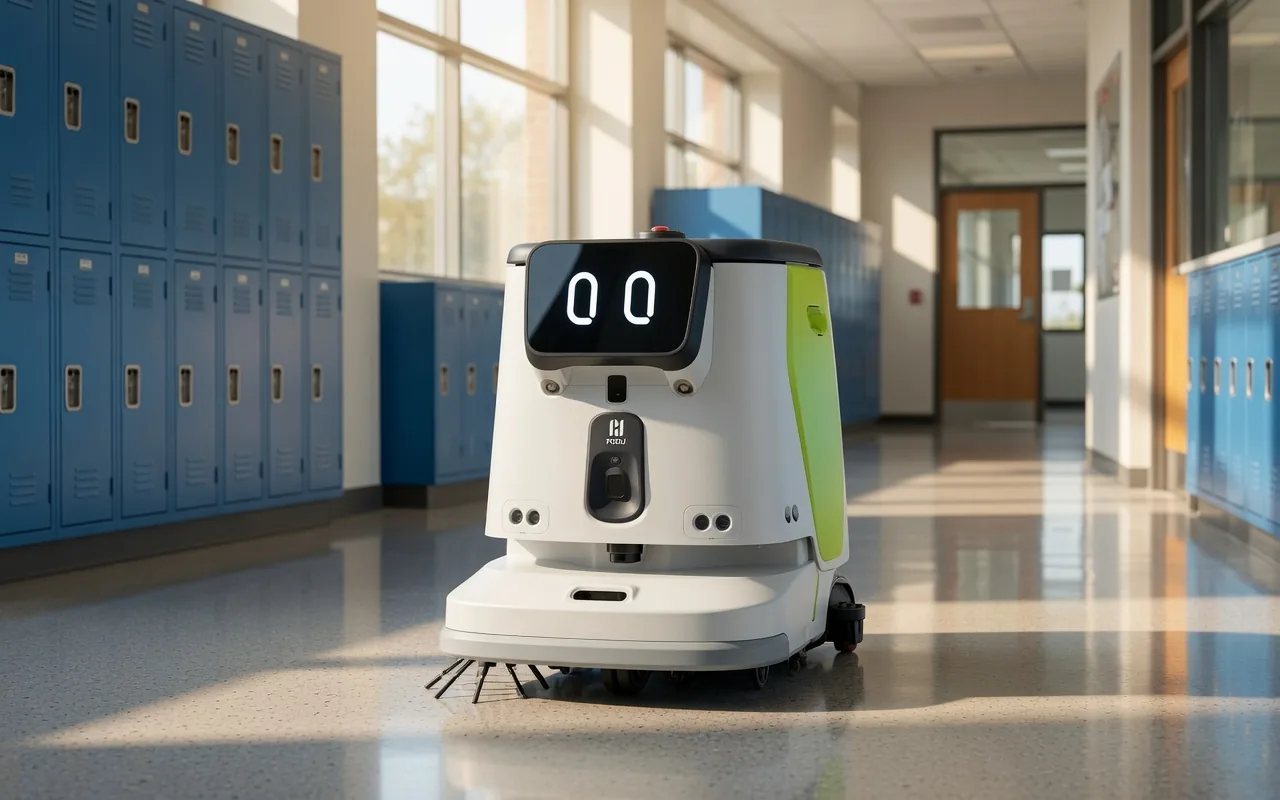
Cleaning robot ROI is not hard to calculate. It is easy to calculate badly, and most of the numbers you will see online are calculated badly in a direction that flatters the robot. This guide gives you the five inputs, a method you can follow with your own figures, three short scenarios, the mistakes to avoid, and a calculator that does the arithmetic for you.
Why the usual ROI number is wrong
Most published cleaning robot ROI figures start from the robot's coverage rate and multiply upward. That is backwards. The robot's speed tells you how much floor it can clean; it says nothing about how many paid hours you actually spend cleaning that floor today. ROI lives in your payroll, not in the spec sheet. So start with what you spend, not with what the machine can do.
The five inputs
1. Labor hours displaced. The routine, repeatable floor work: sweeping, scrubbing, dust mopping, and vacuuming of open areas. Not restrooms, not counters, not detail work. Pull it from your schedules or timesheets as hours per week, then decide what share of those hours a robot can take. We use 60 to 70 percent as a conservative range, because the edges, the obstacles, and the detail work stay with people.
2. Square footage and frequency. How much open floor there is and how often it is cleaned decides how many robots you need and whether one machine can finish inside your cleaning window. A CC1 Pro covers 5,000 to 8,000 square meters on a charge at 700 to 1,000 square meters an hour in full coverage mode. If your nightly floor is bigger than one charge, the input is two robots or a longer window, and the ROI changes accordingly.
3. Shift coverage. The hours nobody is currently cleaning. A robot with a dock that refills, drains, cleans its own brushes, and recharges can run unattended overnight, which is a shift you may not be staffing at all today. This is value on top of displaced hours, and it is the input most calculations leave out because it does not appear on a current timesheet.
4. Consumables. Brushes, pads, squeegee blades, filters, cleaning solution, water, and electricity. Track them against usage hours rather than guessing. They are real, they are small next to labor, and leaving them out is how an ROI figure becomes something a finance director does not trust.
5. Downtime. Hours the robot is not cleaning because of maintenance, a stuck route, or a blocked corridor, and the human time spent recovering it. Early deployments have more; a mapped, well supported deployment has little. Budget for it honestly rather than assuming zero.
A worked method you can follow
Follow the steps with your own figures. The numbers below are an illustration of the arithmetic, not a quote or a customer result.
Step 1: annual routine floor labor. Hours per week of routine floor cleaning, times fully loaded hourly cost, times 52. Fully loaded means wages plus taxes, benefits, and overhead; many operators land between 18 and 25 dollars an hour. Illustration: 30 hours a week at $22 an hour is $34,320 a year.
Step 2: hours the robot absorbs. Multiply by 60 to 70 percent. Illustration: 18 to 21 hours a week, or $20,592 to $24,024 a year in displaced labor. That is the number to carry, not the whole payroll line.
Step 3: add shift coverage you will actually use. If the robot runs an overnight cycle nobody is staffing today, value it at what it would cost to staff, or at zero if you would not have staffed it. Be honest here; this input is where enthusiasm creeps in.
Step 4: subtract consumables and downtime. Illustration: a few thousand dollars a year for consumables and a modest allowance for recovery time. Use your own maintenance guide figures once you have them.
Step 5: set it against the capital input. The manufacturer's suggested retail price is public: $24,000 for the PUDU CC1 Pro. Add the docking station and the accessories your site needs, which we price for your configuration. Divide the annual net saving into the capital total for a simple payback in months. In the illustration above, displaced labor alone on the MSRP gives a payback of roughly 12 to 14 months before the dock and consumables, and longer once they are included; your own numbers will differ.
Step 6: check it against the finance route. Most facilities finance rather than buy. The test then is whether the monthly cost sits comfortably under the monthly labor value from step 2. We prepare that package; how it works is on our financing page, and the wider cost picture, including the docking station and accessories, is in our commercial cleaning robot cost guide.
The method in one line
Annual net saving = (routine floor hours per week x loaded hourly cost x 52 x 60 to 70 percent) + shift coverage you would otherwise pay for, minus consumables and downtime. Payback in months = capital cost (MSRP plus dock and accessories) divided by annual net saving, times 12.
Three short scenarios
Higher education. A campus has long corridors, large open halls, and a cleaning team that is stretched thinnest during term. The routine floor hours are high, they are concentrated in a nightly window, and the buildings are mapped once and stay the same for years. Labor hours displaced and shift coverage both score well; the frequency input is the one to check, because a building cleaned five nights a week returns more than one cleaned twice. The university ROI question we hear most is about the number of buildings, and the answer is that ROI improves as one robot's route is filled, not as more robots are bought. Our schools and universities page covers a campus rollout.
Healthcare. A hospital cleans more often and to a higher standard, and the floor is open and occupied around the clock. Frequency is the strongest input here, and shift coverage matters because a robot can clean a corridor at 3 a.m. without pulling a person off a ward. Downtime deserves a larger allowance, because a blocked corridor is normal in a hospital. Consistency has a value that does not show in payroll: a floor cleaned the same way every night is an infection control input as much as a cost one. See our healthcare page.
Warehouse. Big open floors, dust and debris rather than spills, and a cleaning task that is often done badly because nobody has time. Square footage is the input that decides the machine: a large open floor points at a sweeper or a scrubber such as the MT1 or BG1 rather than a four mode robot. Displaced hours may be modest if the floor is under cleaned today, and the honest ROI often comes from doing the job properly for the first time rather than from replacing hours. Our logistics page covers the floor types.
The mistakes that flatter ROI
Counting the whole cleaner. A robot displaces routine floor hours, not a person. If you count a full salary, the number is fiction and everyone in the room knows it.
Using the coverage rate as the saving. Square meters per hour is a capacity figure. Unless you were paying for that many square meters of cleaning, it is not a saving.
Valuing overnight coverage you would never have staffed at full labor cost. If you would not have paid someone to clean at 3 a.m., that shift is a quality gain, not a labor saving. Count it as the former.
Forgetting the dock. Almost all of the unattended value of a cleaning robot comes from its docking station. Price it in from the start.
Assuming zero downtime and zero consumables. Both are small and both are real, and a finance director will find the omission.
Using a lease payment nobody has quoted. Finance figures depend on your business and the lender's terms. Use MSRP for the capital input and ask us for the actual finance package rather than borrowing a number from a web page.
Use the calculator, then get the real number
Our cleaning labor savings calculator takes your weekly floor cleaning hours, your loaded hourly cost, and your cleaning days, and returns the annual labor you spend today, the hours a robot absorbs at the conservative 70 percent assumption, and a savings range from 60 to 70 percent. Nothing you enter is sent anywhere. It gives you step 1 and step 2 of the method above in ten seconds, which is enough to know whether the conversation is worth having.
The real number needs the rest: your floor plan, your frequency, the dock and accessories for your site, and the finance route. That is the proposal we build after a site assessment, and it is the document your finance team will actually sign off. Book a demo and we will start it.
Frequently asked questions
How do you calculate ROI on cleaning robots?
Start with the routine floor cleaning hours you pay for each week, multiply by your fully loaded hourly cost and by 52, take 60 to 70 percent of that as the hours a robot absorbs, add any shift coverage you would otherwise pay for, subtract consumables and downtime, and divide the result into the capital cost, which is the robot's MSRP plus its docking station and accessories.
How much can I save with cleaning robots?
It depends on your own hours and hourly cost, not on the robot's speed. As an illustration, 30 hours a week of routine floor cleaning at a loaded $22 an hour is $34,320 a year, and a robot absorbing 60 to 70 percent of those hours displaces roughly $20,600 to $24,000 of it. Use the calculator with your own figures.
Is there a cleaning robot ROI calculator?
Yes. Tovrana's free calculator takes your weekly floor cleaning hours, loaded hourly cost, and cleaning days and returns your current annual floor labor, the hours a robot absorbs, and a conservative savings range. Nothing you enter is sent anywhere.
What is the ROI of a cleaning robot for a university?
Campus buildings have long corridors and large halls cleaned on a nightly schedule, which is the shape a cleaning robot suits best. The return grows as one robot's nightly route is filled, so the strongest ROI comes from concentrating a robot on the buildings with the most routine floor hours rather than spreading robots thinly.
See it in your space
Book a live demonstration and we will prepare a full ROI and finance proposal.
Request a demo Explore the robotsGet the Clean Sheet weekly
Practical guidance on commercial cleaning and service robots, one email a week. No spam, and you can unsubscribe any time.